Oftentimes, Salesforce developers create object models that add complexity when building analytics solutions. Since there are certain limits and cost factors inherent to Salesforce, developers will structure their solutions to best align with their own needs — and Analytics developers cannot always influence those decisions upstream.
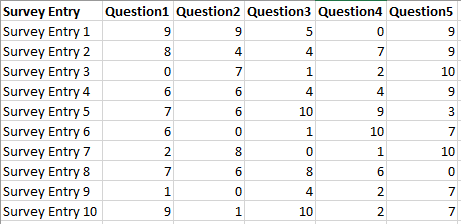
A common example is where a Salesforce object stores related metrics horizontally in columns rather than in rows. A typical case is a Survey Responses object where each row represents an entry (the attribute), the fields represent the survey questions (the measures), and the cells contain the score (the value). The challenge: how do you find which question has the highest or lowest score per entry, or calculate an average score per entry, without resorting to compare table formulas or complex filtering?
The simplest answer: transpose the columns into rows using a dataflow.
This 3-step dataflow approach will transpose your dataset to enable clean row-level aggregations. The example below uses a five-measure dataset — but the pattern scales to any number of measures.
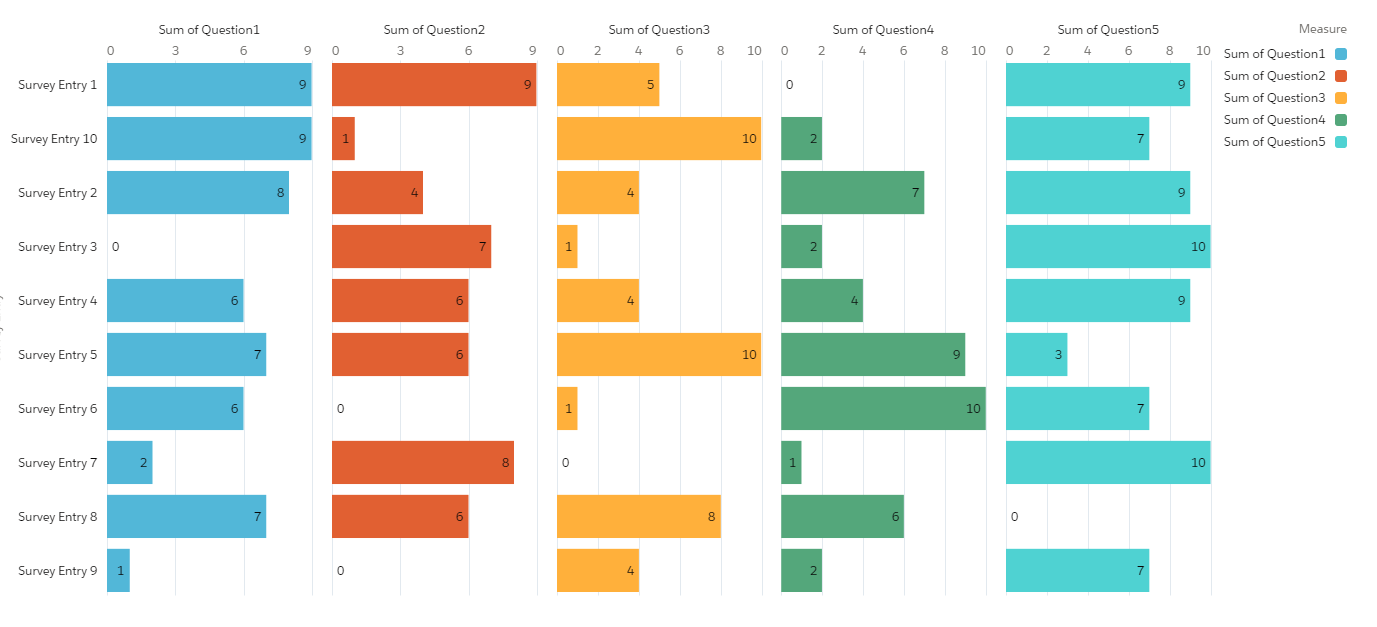
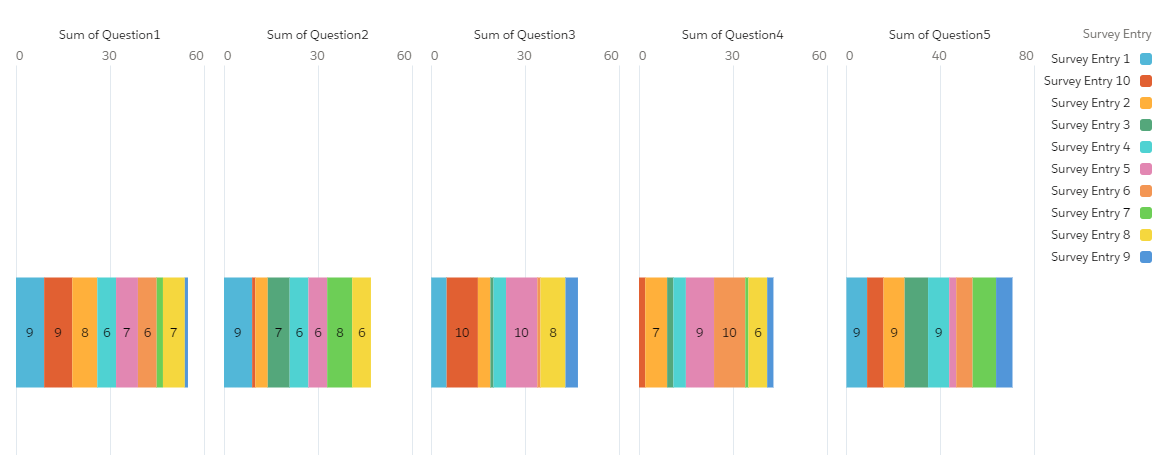
The problem visualised: Computing the max survey score by question gives you one bar per question — five bars for five questions. There is no way to ask “which question scored highest for entry X?” because the data is not structured to support that aggregation. Transposing the data reshapes it so every score becomes its own row, with the question name and entry ID as dimensions — enabling any row-level analysis you need.
For a five-measure dataset you will create five computeExpression nodes — one for each survey question. Each node contains three computed fields. Keep the field names identical across all nodes — this is critical for the Append step to work cleanly.
| Field name | Type | SAQL Expression | Notes |
|---|---|---|---|
| Node 1 — Question 1 | |||
Entry |
Text | 'Survey_Entry' |
Map to the attribute field name from your source dataset |
Score |
Numeric | 'Question1' |
Map to the first measure field. Set Precision and Scale to match source data. |
Question |
Text | "Question 1" |
Optional but recommended — stores the human-readable question label for use in charts. |
| Nodes 2–5 — repeat for each remaining measure | |||
Entry |
Text | 'Survey_Entry' |
Same as Node 1 — must be identical |
Score |
Numeric | 'Question2', 'Question3'… |
Update the measure field name for each node |
Question |
Text | "Question 2", "Question 3"… |
Update the label for each node |
Use the Append transformation to combine all five computeExpression nodes into one dataset. The order of selection does not matter.
Because all computed field names are identical across every node, you do not need to enable “Apply disjoint schema” — the Append will align all fields automatically.
The result is a single dataset where every original column is now a separate row, each tagged with its Entry ID, Score value, and Question label.
After the Append, your dataset still contains the original five measure columns (Question1, Question2…) alongside the new Entry, Score, and Question fields. These original columns are now redundant and will cause confusion in the Explorer.
Add a sliceDataset node after the Append to drop the original measure fields. Keep only: Entry, Score, and Question.
Register the dataset and explore. You can now visualise scores by entry, by question, or both — as grouped bars, stacked bars, or any row-level aggregation.
If your use case requires only the minimum or maximum score per entry, add a computeRelative transformation after the sliceDataset node. This computes a field containing the minimum or maximum value across the entire dataset at the row level — giving you a single scalar per entry without any additional SAQL in the dashboard.